8.7. 演练:带 Leaflet 控件和引导框架的专题地图
在本演练中,您将把本课中学到的一些内容组合在一起,生成包含主题样式和 Leaflet 控件的全面信息地图。地图将使用Bootstrap web表示框架,以便以一种美观的方式使用补充内容进行扩展。您将通过读取选定地图要素的属性来动态构建其中一些内容。
在这个练习中,我们将坚持使用南美洲的地铁数据。最后一个应用程序将允许用户单击任何metro并查看来自Flickr的一些信息文本和图像。静态图例图像也会被带到布局中。
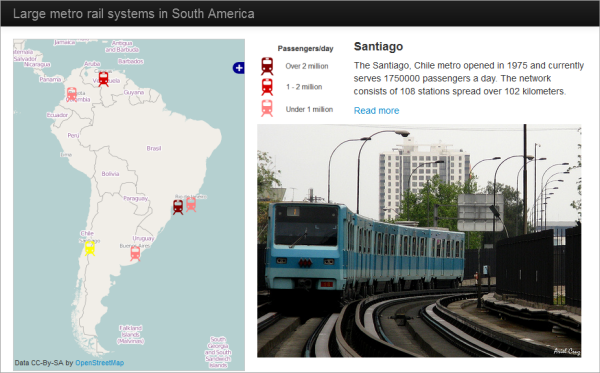
图8.12。
尽管本课称为“超越地图上的点”,但我还是为这次演练故意选择了点数据,以便您可以欣赏Leaflet所提供的可能性,尤其是与其他框架结合在一起时。尽管此时您可能不像JavaScript专家,但您至少应该知道,您不必满足于Internet上看到的“红色泪珠和弹出窗口”混搭。
8.7.1. 下载数据并检查布局
Download the Lesson 8 walkthrough data 把它解压到任何地方。如果愿意,可以将文件放在Jetty主文件夹中,但演练不使用GeoServer,这不是必需的。这些文件包括图例图像、metro SVG图像和metro位置和属性的GeoJSON文件。还要注意,与前面的演练不同,我已经提供了一个包含基本布局标记的HTML文件。我们将在下面的步骤中检查标记的一些关键部分。您还将添加一些JavaScript来给这个应用程序一些生命。还请注意,这些文件包括一个style.css文件,就像我们在前面的课程中使用的那样,但有一个重要的更改:地图的宽度属性已从固定的绝对像素数更改为相对值(90%),以确保地图的div部分将与本演练中使用的引导程序布局模板一起工作。
在web浏览器中打开lesson8_walkthrough.html并查看。你应该可以看到没有地图的应用程序的空外壳。
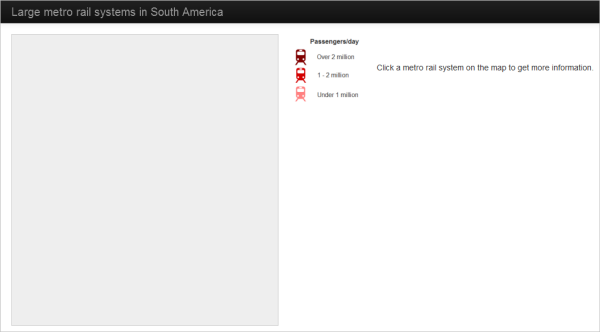
图8.13。
在您喜爱的文本编辑器中打开lesson8_walkthrough.html并查看html标记。布局是基于这个旧的OpenLayers and Bootstrap 示例(此示例中的地图似乎不再工作)。
在添加JavaScript之前,我将只指出布局中的一些重要内容。首先,注意Bootstrap是如何通过引用下面粗体的JavaScript文件(.js)和CSS文件(.CSS)引入应用程序的。我们正在引用CDN中的文件,但您也可以自己下载并托管(和调整)它们。
<script src="http://code.jquery.com/jquery-latest.js"></script>
. . .
<script src="https://maxcdn.bootstrapcdn.com/bootstrap/2.2.1/js/bootstrap.min.js"></script>
<link rel="stylesheet" href="https://maxcdn.bootstrapcdn.com/bootstrap/2.2.1/css/bootstrap.min.css">
还要注意<style>标记中的样式表覆盖。这将防止我们的网页内容撞到顶部横幅。
<style>
  body {
    padding-top: 60px;
    padding-bottom: 40px;
  }
</style>
如果您不喜欢引导(或 Leaflet )默认样式的某些内容,可以在样式表重写中应用更改。
在页面主体中,观察如何使用类将页面组织为导航栏(navbar- * ),容器(容器流体)和跨度。span5和span7类垂直划分页面,以便页面区域的一致比例用于地图(左侧)和补充材料(右侧)。现在不要担心理解所有这些类。请注意,像Bootstrap、Dojo等web开发框架可能会为您提供CSS类,用于以一种跨浏览器一致行为的方式组织页面元素。
最后,请注意,图例图像和“单击metro…”文本被组织到一个HTML表中,以保持它们的刷新。表边框在设计上是不可见的。
<table>
  <tr>
    <td><img src="metro_legend.png"/></td>
    <td id = 'summaryLabel'><p>Click a metro rail system on the map to get more information.</p></td>
  </tr>
</table>
div正在等待Flickr图像,但只有在有人单击地图上的metro符号时才会显示。
<div id="metroImage"></div>
现在让我们通过添加一些JavaScript代码来为这个应用注入活力。
8.7.2. 添加JavaScript逻辑
在这个应用程序中,您将使用JavaScript做三件主要的事情:添加地图、定义符号和处理单击事件。让我们按顺序处理这些问题。
在lesson8_walkthrough.html中,找到脚本标记。您将在以下时间后立即输入所有代码:
<script type="text/javascript">.
添加以下代码行以创建地图和初始化函数。此函数包含一些变量,我们将使用这些变量来处理整个过程中的选择,类似于您在第7课中看到的内容:
var map;
var metroLayer;

function init() {

  // create map and set center and zoom level
  map = new L.map('mapid');
  map.setView([-28,-62],3);

  var selection;
  var selectedLayer;
  var selectedFeature;

  . . .
}
现在让我们创建一些图层并将它们放到地图上。下面的代码创建了两个瓦片的基本地图层和metro层。它只将一个基本图层添加到地图中;另一个基本地图层最终将成为层切换器中的一个选项。
更换 . . . 在上面的代码中包含以下内容。虽然很多,但是如果您注意到本课前面的代码片段,所有这些看起来都很熟悉:
// create and add osm tile layer var osm = L.tileLayer('http://{s}.tile.openstreetmap.org/{z}/{x}/{y}.png', { maxZoom: 19, attribution: '© <a href="http://www.openstreetmap.org/copyright">OpenStreetMap</a>' }); osm.addTo(map); // create stamen osm layer (not adding it to map) var stamen = L.tileLayer('http://tile.stamen.com/toner/{z}/{x}/{y}.png', { maxZoom: 19, attribution: '© <a href="http://www.openstreetmap.org/">OpenStreetMap</a> and contributors, under an <a href="http://www.openstreetmap.org/copyright" title="ODbL">open license</a>. Toner style by <a href="http://stamen.com">Stamen Design</a>' }); // create metro icons var metroLowIcon = L.icon({ iconUrl: 'metro_low.svg', iconSize: [25,25] }); var metroMediumIcon = L.icon({ iconUrl: 'metro_medium.svg', iconSize: [25,25] }); var metroHighIcon = L.icon({ iconUrl: 'metro_high.svg', iconSize: [25,25] }); var metroSelected = L.icon({ iconUrl: 'metro_selected.svg', iconSize: [25,25] }); // add the metro GeoJSON layer var metroLayer = L.geoJson(metroData,{ pointToLayer: function (feature, latlng) { return L.marker(latlng, {icon: iconByPassday(feature)}); }, onEachFeature: metrosOnEachFeature }); metroLayer.addTo(map); . . .您可能已经注意到metroLayer依赖于两个功能:iconByPassday和metrosOnEachFeature。我们会在几分钟内解决这些问题。但首先,层切换器...
更换 . . .在上面的代码中,要将层切换器控件添加到地图:
// define basemap and thematic layers and add layer switcher control
var basemaps = {
  "OSM": osm,
  "Stamen": stamen
};

var overlays = {
  "Metro stations": metroLayer
 };

L.control.layers(basemaps,overlays).addTo(map);

. . .
同样,这里的模式是为基础地图和主题层创建一个JavaScript对象,然后在创建控件时将这两个对象作为参数传入。
对于我提到的那些功能。第一个图标iconByPassday查看每天通过每个地铁系统的乘客数量,然后决定使用哪个图标。这是将图层分类并用不同颜色表示的关键。更换 . . . 在上面的代码中包含以下内容:
// define functions that right icon for a given feature
function iconByPassday(feature) {
  var icon;
  if (feature.properties.PASSDAY >= 2000000) icon = metroHighIcon;
  else if (feature.properties.PASSDAY >= 1000000) icon = metroMediumIcon;
  else icon = metroLowIcon;

  return icon;
}

. . .
现在是metrosOnEachFeature函数。这个有点长。它将一个点击事件监听器添加到metros层,然后定义一个函数来处理该事件。更换 . . . 在上面的代码中包含以下内容:
// define function to handle click events on metro features
function metrosOnEachFeature(feature, layer){
  layer.on({
    click: function(e) {
      // reset symbol of old selection
      if (selection) {
        if (selectedLayer === metroLayer) selection.setIcon(iconByPassday(selectedFeature));
      }

      // apply yellow icon to newly selected metro and update selection variables
      e.target.setIcon(metroSelected);
      selection = e.target;
      selectedLayer = metroLayer;
      selectedFeature = feature;

      // using attributes, construct some HTML to write into the page
      var featureName = feature.properties.CITY || 'Unnamed feature';
      var country = feature.properties.COUNTRY || '(Unknown)';
      var year = feature.properties.YEAR || '(Unknown)';
      var passengers = feature.properties.PASSDAY || '(Unknown)';
      var stations = feature.properties.STATIONS || '(Unknown)';
      var length = feature.properties.LENGTHKM || '(Unknown)';
      var link = feature.properties.LINK || 'http://www.wikipedia.org';
      var photoHtml = feature.properties.PHOTO || '<P>Photo not available</P>';
      var titleHtml = '<p style="font-size:18px"><b>' + featureName + '</b></p>';
      var descripHtml = '<p>The ' + featureName + ', ' + country + ' metro opened in ' + year + ' and currently serves ' + passengers + ' passengers a day. The network consists of ' + stations + ' stations spread over ' + length + ' kilometers.</p>';
      var readmoreHtml = '<p><a href="' + link + '">Read more</a></p>';
      document.getElementById('summaryLabel').innerHTML = titleHtml + descripHtml + readmoreHtml;
      document.getElementById('metroImage').innerHTML = photoHtml;

      L.DomEvent.stopPropagation(e); // stop click event from being propagated further
    }
  });
}

. . .
检查上面的代码注释,了解每个部分都在做什么。有很多代码,但大多数都是构建描述metro系统的信息HTML。回想一下,属性表如下所示:
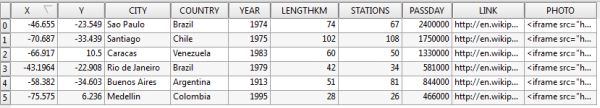
图8.15。
您应该注意到上面的代码中引用了许多这些属性字段名称。使用某些特殊语法||检索字段值。(在JavaScript中返回第一个操作数为TRUE的逻辑OR运算符)以设置后备值,以防万一没有属性返回。该函数的其余部分构造一些HTML字符串,并在适当的位置插入属性。在构造HTML字符串之后,将为元素“ summaryLabel”和“ metroImage”更新innerHTML。这将导致新文本和照片出现在页面的右侧。
照片领域值得在这里进行一些额外的讨论。预期此字段将用于在应用程序中嵌入照片,整个iframe HTML代码将作为长字符串放置在此字段中。如果要生成这样的数据集,从哪里获取此代码?就在Flickr嵌入功能中:
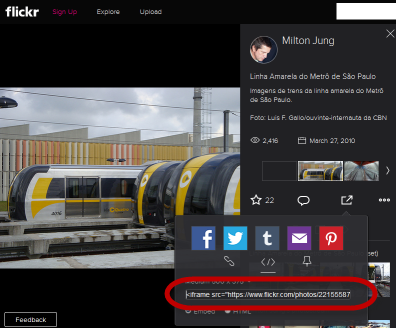
图8.16。
最后,将一个click事件处理程序添加到将重置选择的地图中。这是必要的,如果有人点击地图,但不是地铁图标。更换 . . . 在上面的代码中包含以下内容:
// define and register event handler for click events to unselect features when clicked anywhere else on the map
map.addEventListener('click', function(e) {
  if (selection) {
    if (selectedLayer === metroLayer) selection.setIcon(iconByPassday(selectedFeature));

    selection = null;

    document.getElementById('summaryLabel').innerHTML = '<p>Click a metro rail system on the map to get more information.</p>';
    document.getElementById('metroImage').innerHTML = ''
  }
});
注意,这里添加了一些代码来清除信息HTML和照片。
在web浏览器中打开lesson8_walkthrough.html来测试应用程序。(如果您只是从文件系统直接打开HTML文件,我建议您使用Firefox进行测试。这是因为Chrome和Internet Explorer中的跨源请求安全实现只允许在web服务器上托管HTML和GeoJSON文件时加载GeoJSON。)
您应该能够在不同的基础层之间切换(注意下面显示的MapQuestOpenLayer不再可用)。单击metro图标可查看突出显示的符号、Flickr图像和描述性文本。
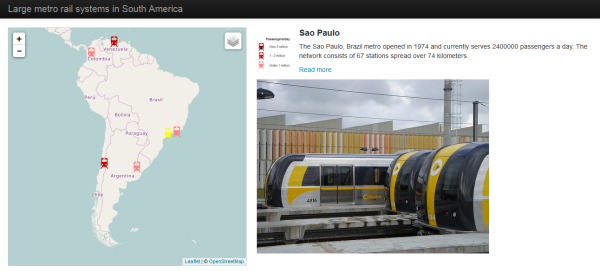
图8.17。
8.7.3. 演练的最终代码
如果演练不起作用,请检查以确保已连接到Internet,并且代码与以下代码匹配:
<!DOCTYPE html>
<html>
<head>
<meta http-equiv="Content-Type" content="text/html; charset=utf-8">
<title>Lage metro rail systems in South America</title>
<link rel="stylesheet" href="https://cdnjs.cloudflare.com/ajax/libs/leaflet/1.2.0/leaflet.css" type="text/css" crossorigin="">
<script src="https://cdnjs.cloudflare.com/ajax/libs/leaflet/1.2.0/leaflet.js" crossorigin=""></script>
<script src="http://ajax.googleapis.com/ajax/libs/jquery/1.9.1/jquery.min.js"></script>
<script src="metro.js"></script>
<link rel="stylesheet" href="style.css" type="text/css">
<script src="https://maxcdn.bootstrapcdn.com/bootstrap/2.2.1/js/bootstrap.min.js"></script>
<link rel="stylesheet" href="https://maxcdn.bootstrapcdn.com/bootstrap/2.2.1/css/bootstrap.min.css">
<style>
body {
padding-top: 60px;
padding-bottom: 40px;
}
</style>
<script type="text/javascript">
var map;
var metroLayer;
function init() {
// create map and set center and zoom level
map = new L.map('mapid');
map.setView([-28,-62],3);
var selection;
var selectedLayer;
var selectedFeature;
// create and add osm tile layer
var osm = L.tileLayer('http://{s}.tile.openstreetmap.org/{z}/{x}/{y}.png', {
maxZoom: 19,
attribution: '© <a href="http://www.openstreetmap.org/copyright">OpenStreetMap</a>'
});
osm.addTo(map);
// create stamen osm layer (not adding it to map)
var stamen = L.tileLayer('http://tile.stamen.com/toner/{z}/{x}/{y}.png', {
maxZoom: 19,
attribution: '© <a href="http://www.openstreetmap.org/">OpenStreetMap</a> and contributors, under an <a href="http://www.openstreetmap.org/copyright" title="ODbL">open license</a>. Toner style by <a href="http://stamen.com">Stamen Design</a>'
});
// create metro icons
var metroLowIcon = L.icon({
iconUrl: 'metro_low.svg',
iconSize: [25,25]
});
var metroMediumIcon = L.icon({
iconUrl: 'metro_medium.svg',
iconSize: [25,25]
});
var metroHighIcon = L.icon({
iconUrl: 'metro_high.svg',
iconSize: [25,25]
});
var metroSelected = L.icon({
iconUrl: 'metro_selected.svg',
iconSize: [25,25]
});
// add the metro GeoJSON layer
var metroLayer = L.geoJson(metroData,{
pointToLayer: function (feature, latlng) {
return L.marker(latlng, {icon: iconByPassday(feature)});
},
onEachFeature: metrosOnEachFeature
});
metroLayer.addTo(map);
// define basemap and thematic layers and add layer switcher control
var basemaps = {
"OSM": osm,
"Stamen": stamen
};
var overlays = {
"Metro stations": metroLayer
};
L.control.layers(basemaps,overlays).addTo(map);
// define functions that right icon for a given feature
function iconByPassday(feature) {
var icon;
if (feature.properties.PASSDAY >= 2000000) icon = metroHighIcon;
else if (feature.properties.PASSDAY >= 1000000) icon = metroMediumIcon;
else icon = metroLowIcon;
return icon;
}
// define function to handle click events on metro features
function metrosOnEachFeature(feature, layer){
layer.on({
click: function(e) {
// reset symbol of old selection
if (selection) {
if (selectedLayer === metroLayer) selection.setIcon(iconByPassday(selectedFeature));
}
// apply yellow icon to newly selected metro and update selection variables
e.target.setIcon(metroSelected);
selection = e.target;
selectedLayer = metroLayer;
selectedFeature = feature;
// using attributes, construct some HTML to write into the page
var featureName = feature.properties.CITY || 'Unnamed feature';
var country = feature.properties.COUNTRY || '(Unknown)';
var year = feature.properties.YEAR || '(Unknown)';
var passengers = feature.properties.PASSDAY || '(Unknown)';
var stations = feature.properties.STATIONS || '(Unknown)';
var length = feature.properties.LENGTHKM || '(Unknown)';
var link = feature.properties.LINK || 'http://www.wikipedia.org';
var photoHtml = feature.properties.PHOTO || '<P>Photo not available</P>';
var titleHtml = '<p style="font-size:18px"><b>' + featureName + '</b></p>';
var descripHtml = '<p>The ' + featureName + ', ' + country + ' metro opened in ' + year + ' and currently serves ' + passengers + ' passengers a day. The network consists of ' + stations + ' stations spread over ' + length + ' kilometers.</p>';
var readmoreHtml = '<p><a href="' + link + '">Read more</a></p>';
document.getElementById('summaryLabel').innerHTML = titleHtml + descripHtml + readmoreHtml;
document.getElementById('metroImage').innerHTML = photoHtml;
L.DomEvent.stopPropagation(e); // stop click event from being propagated further
}
});
}
// define and register event handler for click events to unselect features when clicked anywhere else on the map
map.addEventListener('click', function(e) {
if (selection) {
if (selectedLayer === metroLayer) selection.setIcon(iconByPassday(selectedFeature));
selection = null;
document.getElementById('summaryLabel').innerHTML = '<p>Click a metro rail system on the map to get more information.</p>';
document.getElementById('metroImage').innerHTML = ''
}
});
}
</script>
</head>
<body onload="init()">
<div class="navbar navbar-inverse navbar-fixed-top">
<div class="navbar-inner">
<div class="container-fluid">
<a class="brand" href="/">Large metro rail systems in South America</a>
</div>
</div>
</div>
<div class="container-fluid">
<div class="row-fluid">
<div class="span5">
<div id="mapid">
</div>
</div>
<div class="span7">
<div>
<table>
<tr>
<td><img src="metro_legend.png"/></td>
<td id = 'summaryLabel'><p>Click a metro rail system on the map to get more information.</p></td>
</tr>
</table>
<div id="metroImage"></div>
</div>
</div>
</div>
</div>
</body>
</html>